El Miedo como una Señal
El S&P 500 cierra la semana en 6.368 puntos, el VIX cotiza a 31, un 56% por encima de su nivel de enero, y el crudo WTI ha llegado a tocar los 100 dólares por barril por primera vez desde 2022. El Estrecho de Ormuz, por el que transita el 20% del suministro mundial de petróleo, lleva prácticamente cerrado al tráfico comercial desde el 2 de marzo. Y en medio de todo esto, algo curioso está ocurriendo en el mercado de opciones sobre el S&P 500: los inversores están comprando coberturas a niveles que no se veían en la historia reciente.
La pregunta que conviene hacerse no es si hay miedo. Es evidente que lo hay. La pregunta relevante es si ese miedo ya está completamente descontado y, si es así, qué ocurre cuando el catalizador negativo resulta menos grave de lo esperado.
Los números detrás del miedo
JPMorgan ha publicado recientemente el posicionamiento estimado del Put Delta de sus clientes sobre el S&P 500. La lectura es contundente: la métrica ha caído hasta aproximadamente -70.000 millones de dólares, niveles que no se registraban en todo el histórico disponible desde 2019, superando incluso los picos de pánico de marzo de 2020 y octubre de 2022
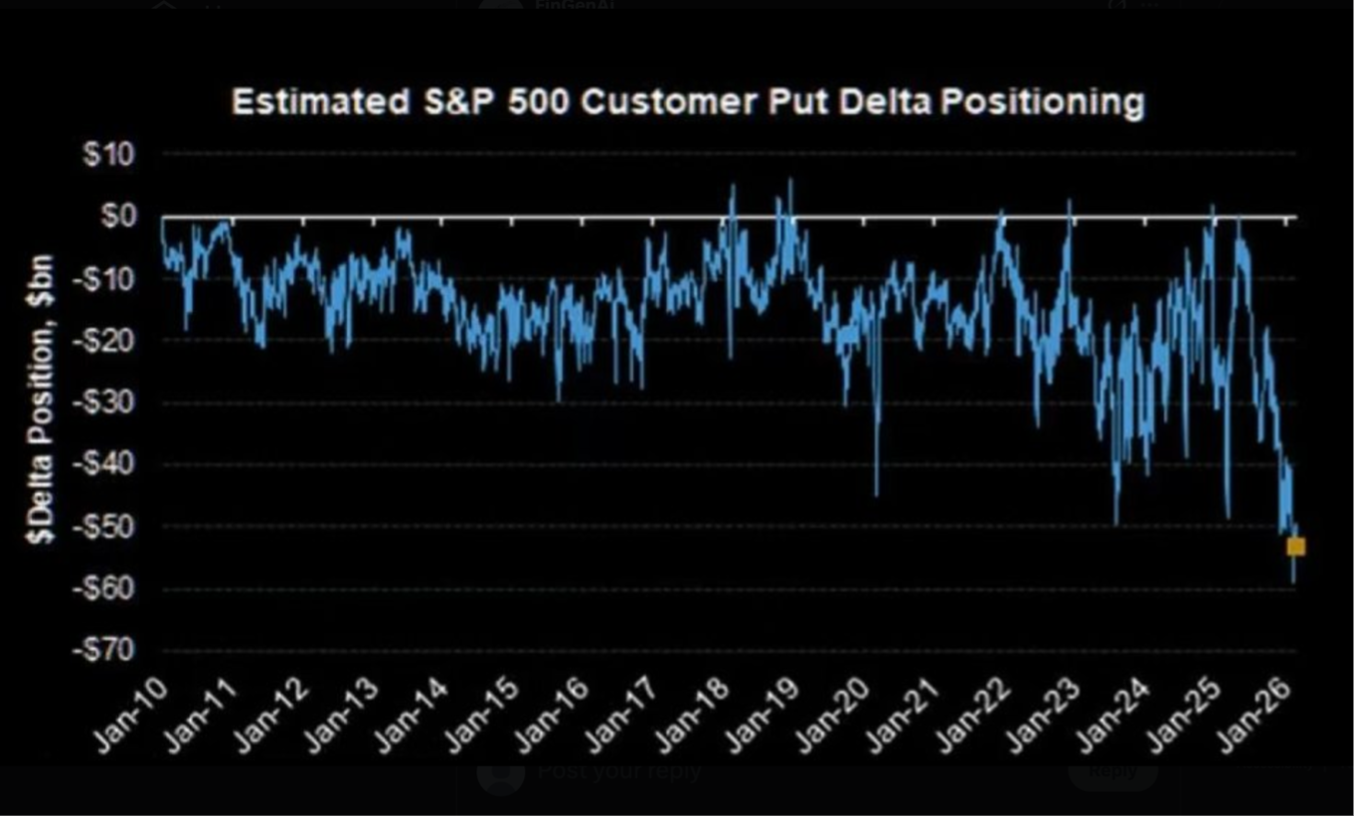
JPMorgan — Posicionamiento estimado Put Delta de clientes sobre el S&P 500
Para quien no esté familiarizado con este concepto: el Delta de una opción mide cómo varía el precio de esa opción respecto al activo subyacente. Cuando el Put Delta agregado de los clientes institucionales y minoristas cae a estos niveles tan negativos, significa una sola cosa: el mercado ha comprado una cantidad masiva de opciones de venta. Básicamente, están pagando primas elevadas para asegurar sus carteras frente a una posible reestructuración del mercado.
A esto se suma el ratio Put/Call del SPX, que cerró en 1,23 el pasado 26 de marzo. Por encima de 1 significa que hay más puts que calls en circulación: más inversores apostando a la baja o cubriéndose de ella que posicionados al alza. El VIX, por su parte, promedia 25,36 en lo que va de marzo frente a los 16,1 de febrero, y llegó a tocar los 35,30 a mediados de mes.
¿Qué es el Put Delta y por qué importa?
Una opción put da a su comprador el derecho a vender un activo a un precio determinado antes de una fecha concreta. Cuando muchos inversores compran puts simultáneamente, los creadores de mercado (market makers) que las venden acumulan exposición contraria: se quedan 'cortos de delta'. Para cubrirse, venden el activo subyacente, lo que presiona el mercado a la baja. Cuando esas coberturas se deshacen debido a que el miedo se disipa, ocurre el proceso inverso: recompras masivas que empujan los índices al alza con rapidez y violencia. A esto se le llama short squeeze.
Los número detrás del miedo:
El mercado de crédito confirma la misma lectura. Tomemos como ejemplo los CDS a 5 años de Oracle, estos han alcanzado los 191 puntos básicos, niveles no vistos desde 2008 y cuatro veces superiores a los de mediados de 2025. El dato no es una señal de quiebra inminente, sino algo mas revelador. El mercado de crédito está exigiendo una prima de riesgo sustancialmente mayor que hace un año. Opciones y crédito, apuntan a la misma dirección.
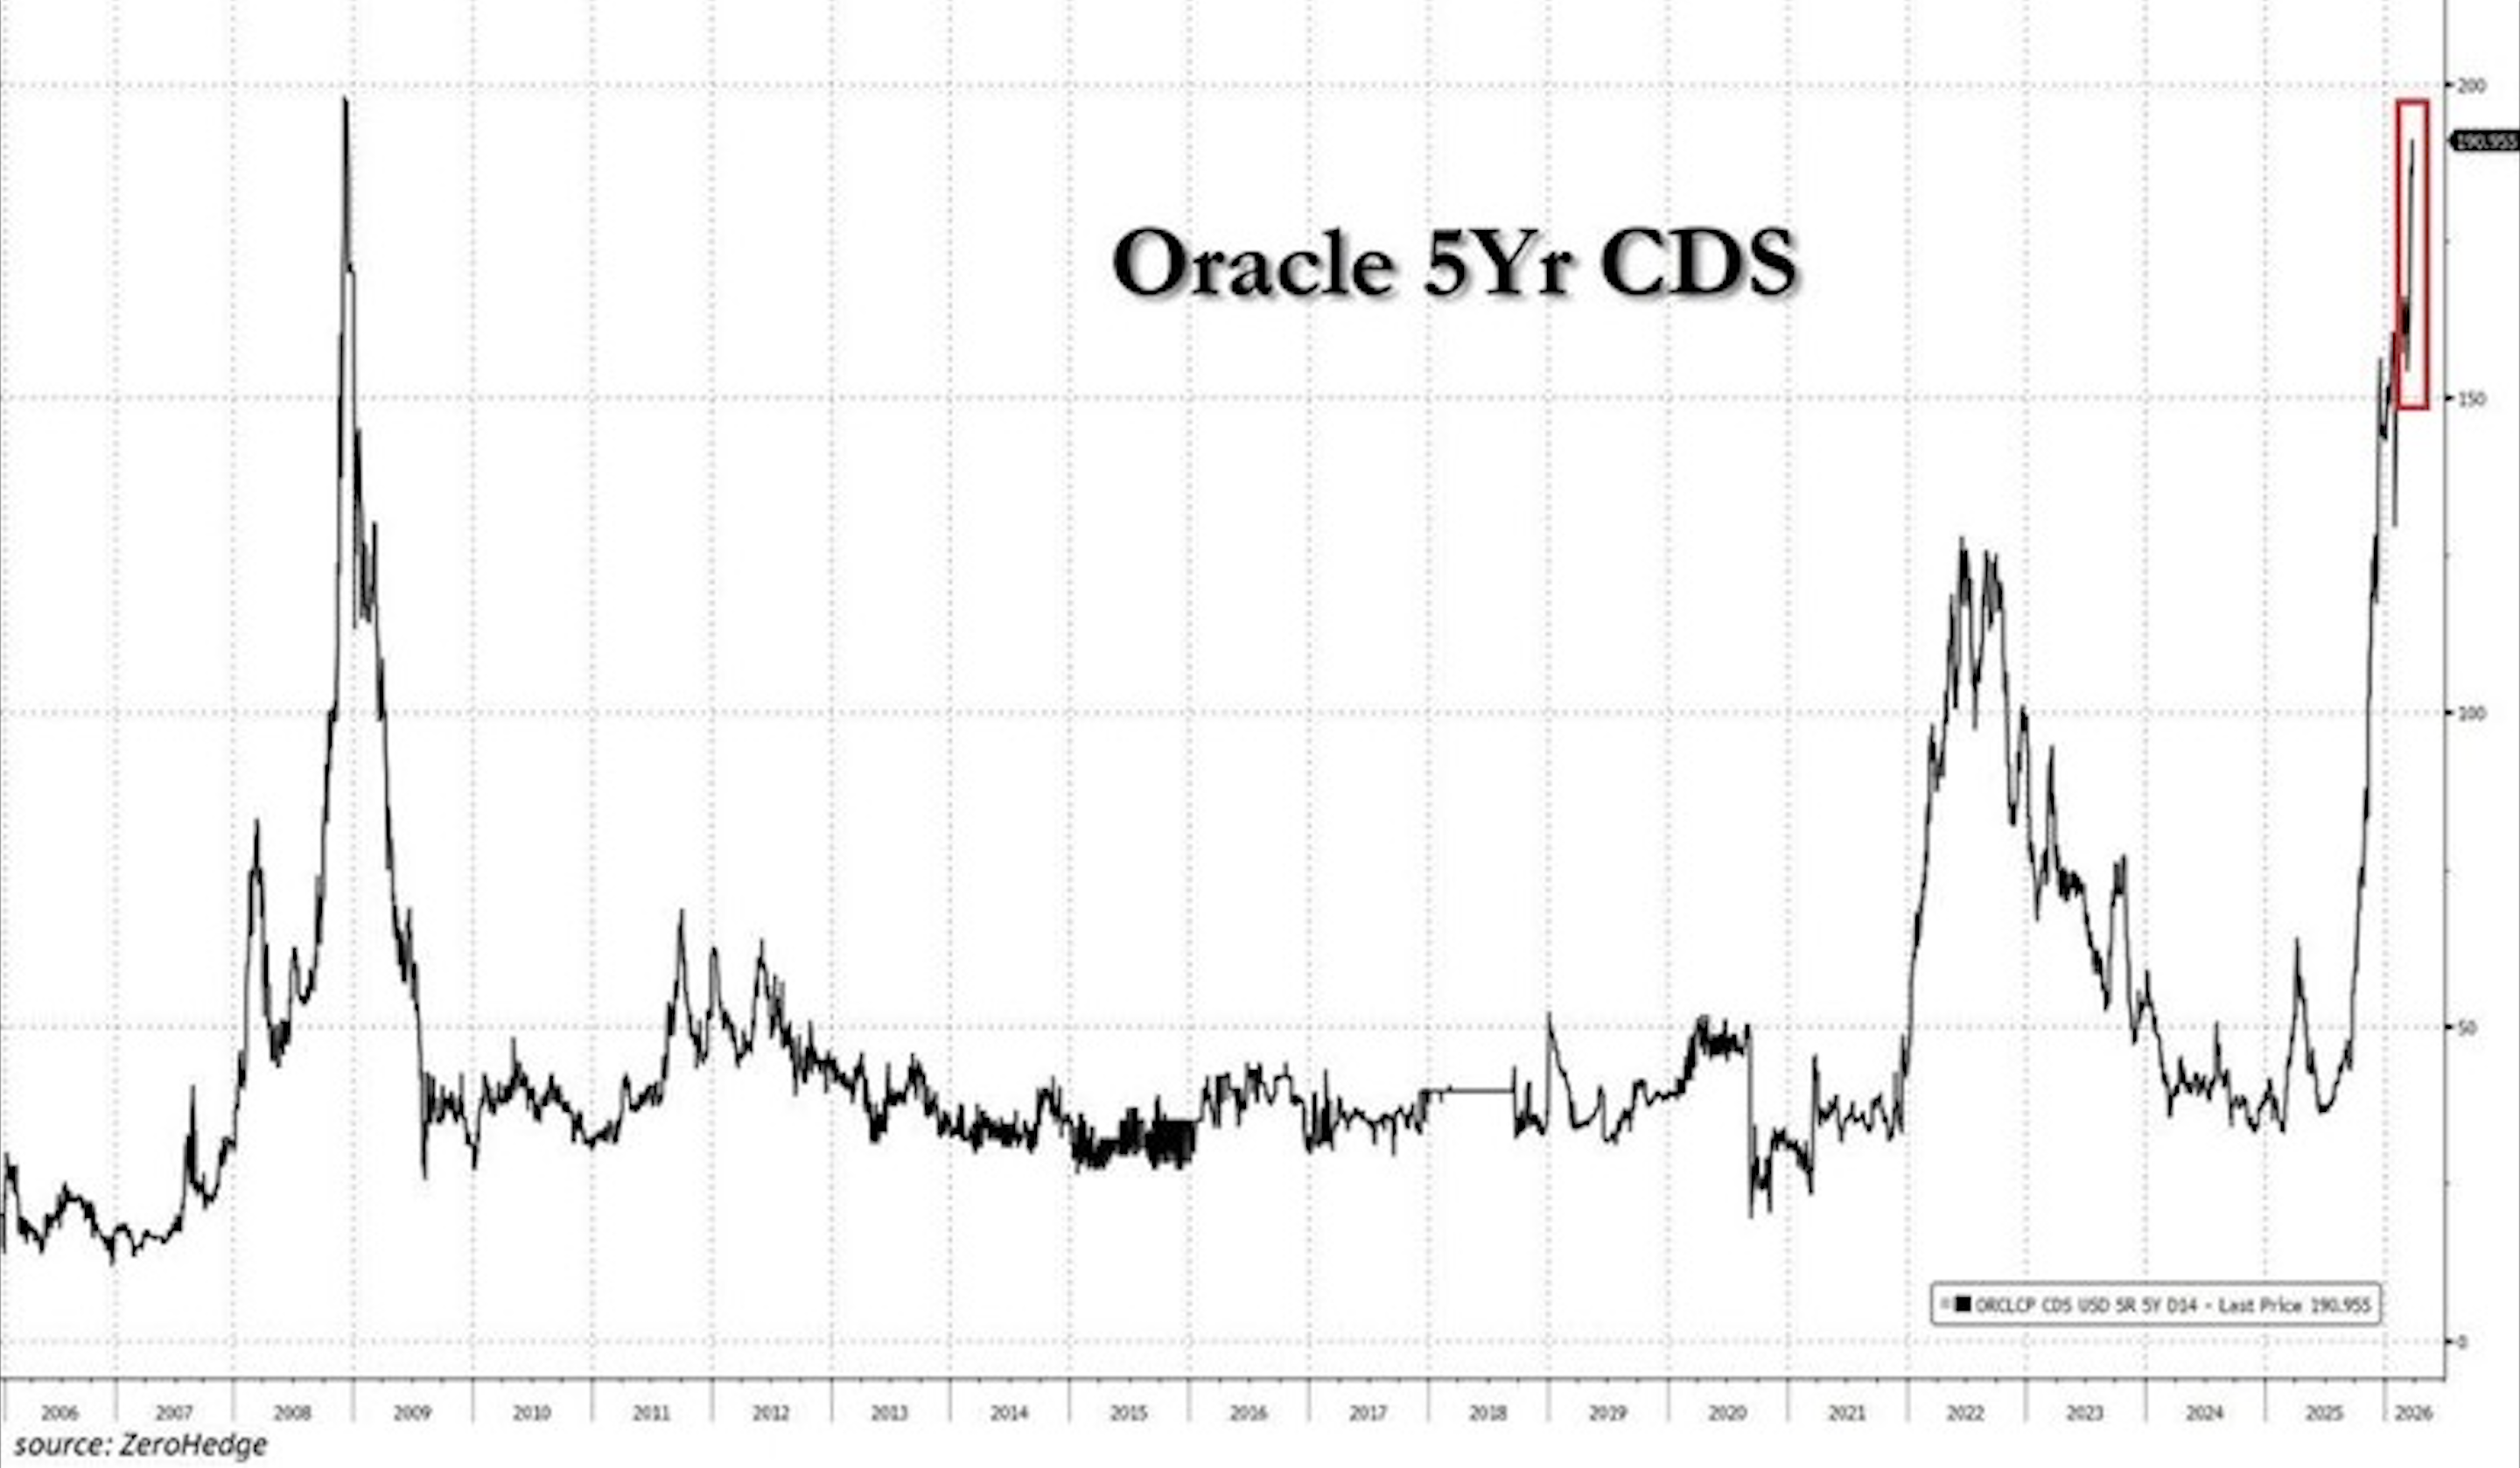
ZeroHedge — Oracle 5Yr CDS (2006–2026). Último precio registrado: 190,955 pb.
El contexto macro: cuando el catalizador sí es real
El elemento diferenciador de este episodio respecto a otros momentos de posicionamiento defensivo extremo es que, en esta ocasión, el catalizador negativo existe y es verificable. El conflicto entre Estados Unidos e Irán, iniciado a finales de febrero, ha cerrado de facto el Estrecho de Ormuz al tráfico comercial, interrumpiendo el equivalente a 17,8 millones de barriles diarios de flujos de petróleo y derivados. La Agencia Internacional de la Energía ha calificado la situación como el mayor desafío de seguridad energética global de la historia.
El WTI cerró el viernes 27 de marzo en 99,64 dólares por barril, llegando a tocar los 100,04 dólares intradía. El Brent cerró en 112,57 dólares. Goldman Sachs estima una prima geopolítica de entre 14 y 18 dólares por barril incorporada en los precios actuales. La Reserva Federal de Dallas proyecta que, si el cierre del Estrecho se prolonga un trimestre, el WTI promediará 98 dólares y el crecimiento del PIB global se reducirá un 2,9% en tasa anualizada.
Este escenario tiene un precedente histórico directo que los mercados están manejando como referencia.
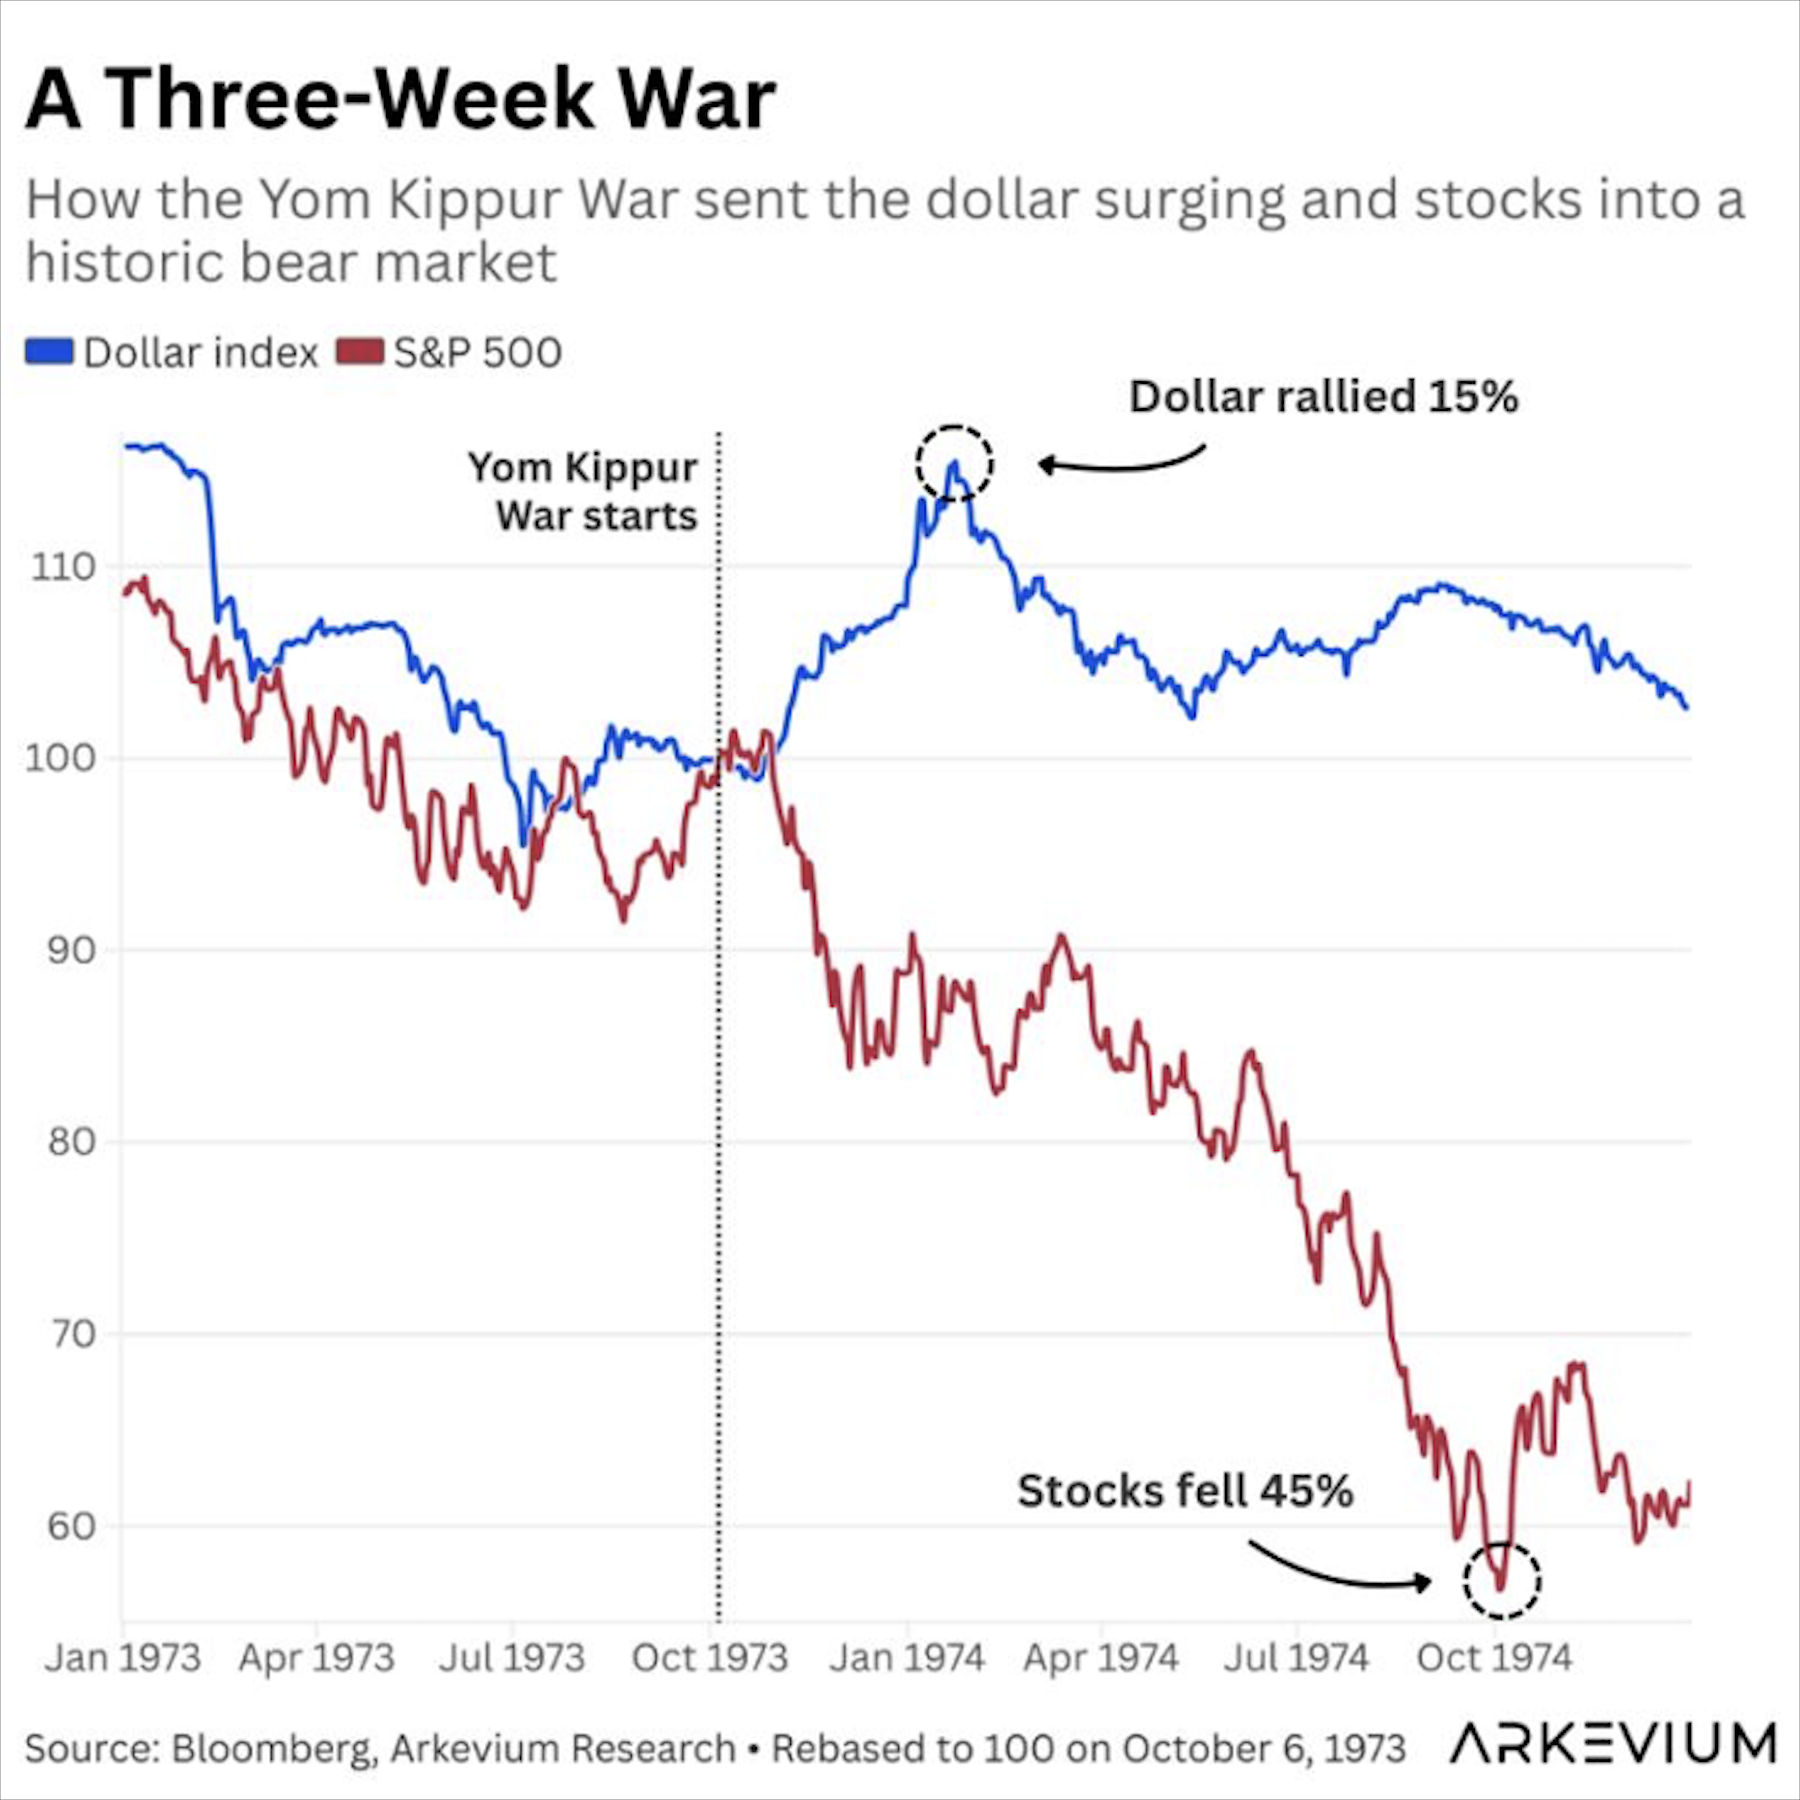
Fuente: Bloomberg, Arkevium Research — La Guerra de Yom Kippur (1973)
En octubre de 1973, el embargo de petróleo árabe desencadenado por la Guerra de Yom Kippur produjo una de las peores caídas bursátiles del siglo XX: el S&P 500 perdió un 45% mientras el dólar se apreciaba un 15%. Pero, como siempre en los mercados, el momento y la intensidad del shock fueron los factores determinantes. Quien compró en el punto de máximo pánico —cuando las coberturas defensivas eran más extremas— obtuvo retornos extraordinarios en los 12 meses siguientes.
La diferencia relevante entre 1973 y 2026 es que el mercado actual tiene dos mecanismos que el de entonces no tenía: reservas estratégicas masivas, la AIE ha acordado liberar 400 millones de barriles, la mayor liberación de la historia, y Trump ha extendido el plazo a Irán hasta el 6 de abril para reabrir el Estrecho. Esa fecha se convierte en el próximo punto binario para los mercados.
La doble lectura: indicador contrario o cobertura justificada
Los datos de posicionamiento tienen una característica que conviene entender bien, no predicen el desenlace, pero sí revelan dónde está posicionado el consenso. Y cuando el consenso está tan cargado de coberturas defensivas como ahora, cualquier mejora en el entorno, por mínima que sea, puede desencadenar un movimiento al alza desproporcionado.
Esto es así por la mecánica del mercado, no por optimismo. Los market makers que han vendido esas opciones put tienen que cubrirse vendiendo el activo subyacente mientras el mercado cae. Cuando el catalizador negativo se disipa o pierde intensidad, tienen que deshacerlas comprando. Ese proceso de recompra forzada, sumado al cierre de posiciones cortas acumuladas, puede generar subidas rápidas e intensas aunque los fundamentos no hayan cambiado estructuralmente.
Un dato adicional que refuerza esta lectura: el VIX de opciones a corto plazo (VIX9D) ha cotizado con una prima significativa sobre el VIX estándar en las últimas sesiones de marzo. Esto indica que el pánico está concentrado en el muy corto plazo, en los próximos días, no en los próximos meses, lo que es consistente con una cobertura táctica masiva, no con un reposicionamiento estructural bajista de largo plazo.
Escenario alcista (Bull Case): si el conflicto con Irán se desescala antes del 6 de abril, o simplemente no se agrava, el mercado tiene el combustible necesario para un rebote rápido e intenso. La combinación de coberturas extremas en opciones, posiciones cortas acumuladas y un VIX en zona de capitulación crea las condiciones perfectas para un gamma squeeze. En este escenario, el S&P 500 podría recuperar los 6.600 puntos en cuestión de días, no de semanas.
Escenario bajista (Bear Case): si el Estrecho de Ormuz permanece cerrado más allá de mediados de abril, la Reserva Federal de Dallas ya modeliza una contracción del PIB global. En ese caso, las coberturas defensivas actuales no son una anomalía sino el inicio de un ajuste más profundo. El VIX podría retornar a la zona de 40-50, y la corrección del S&P 500 se extendería hacia los 6.000-6.200 puntos o por debajo.
El posicionamiento actual no miente, el miedo a una corrección es real y demostrado. Pero los mercados tienen una memoria particular, marzo 2020, octubre 2022, agosto 2024, y esa memoria dice que los momentos de cobertura extrema han sido, históricamente, los mejores puntos de entrada. No porque el riesgo no existiera, sino porque ya estaba descontado del precio. Hoy el VIX está en 31, el Put Delta en mínimos históricos y el mercado lleva semanas pagando primas récord por protegerse.
Como dijo Warren Buffett: "Be greedy when others are fearful." Hoy el miedo es histórico, medible y colectivo. Y los estrechos que cierran el paso, históricamente, no han hundido a los que esperaban en el puerto, sino a los que ya habían abandonado el barco.
Finance Generation · Este artículo tiene carácter informativo y no constituye asesoramiento de inversión.
The S&P 500 closes the week at 6,368 points. The VIX trades at 31 — 56% above its January level — and WTI crude has touched $100 per barrel for the first time since 2022. The Strait of Hormuz, through which 20% of the world's oil supply flows, has been effectively closed to commercial traffic since March 2nd. And amid all of this, something striking is happening in the S&P 500 options market: investors are buying hedges at levels not seen in recent history.
The question worth asking is not whether fear exists. It clearly does. The relevant question is whether that fear is already fully priced in — and if so, what happens when the negative catalyst turns out to be less severe than expected.
The Numbers Behind the Fear
JPMorgan recently published its estimated Put Delta positioning for clients on the S&P 500. The reading is unambiguous: the metric has dropped to approximately -$70 billion, levels not recorded in the entire historical dataset available since 2019 — surpassing even the panic peaks of March 2020 and October 2022
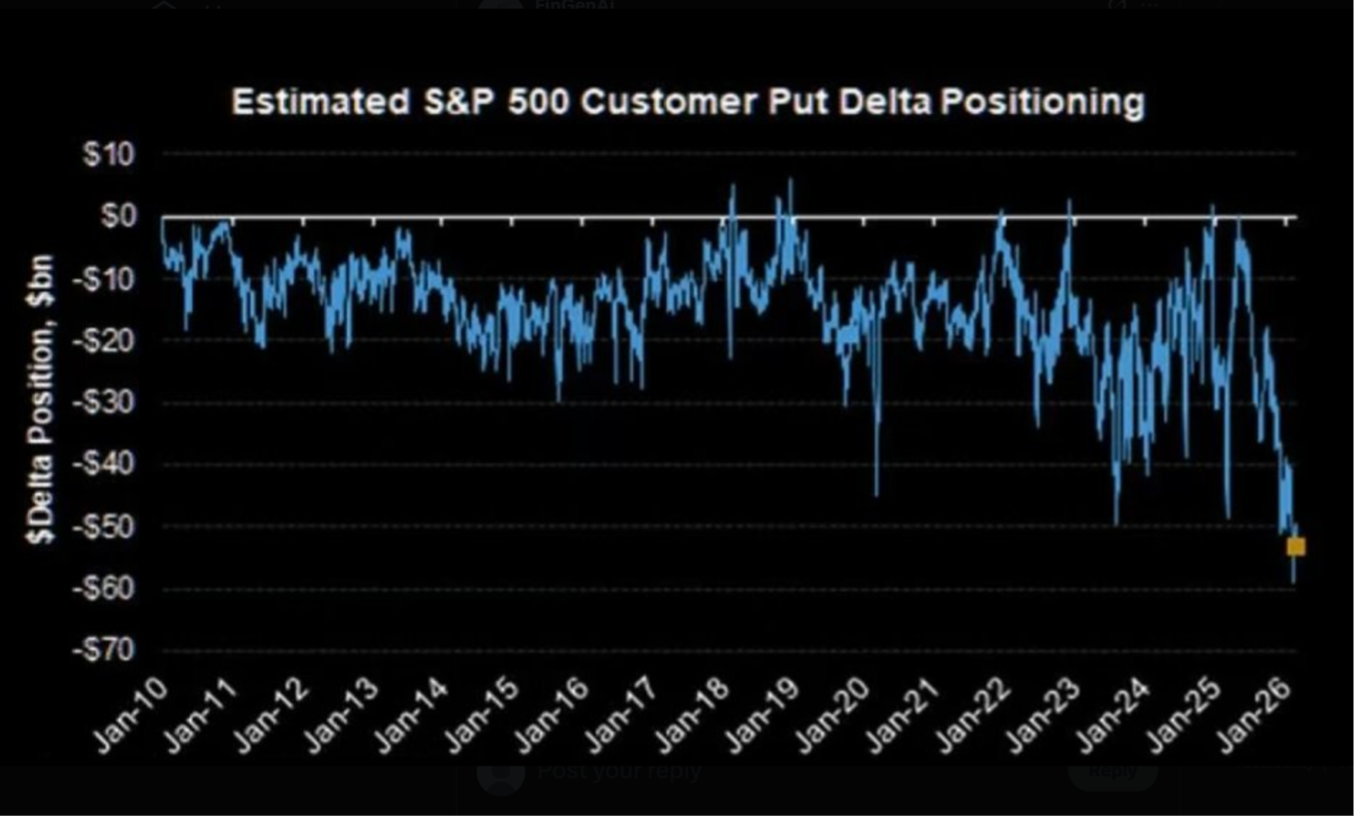
Source: JPMorgan — Estimated Customer Put Delta Positioning on the S&P 500
For those unfamiliar with the concept: an option's Delta measures how much the option's price changes relative to the underlying asset. When the aggregate Put Delta of institutional and retail clients falls to these deeply negative levels, it means one thing: the market has purchased a massive volume of put options. In plain terms, investors are paying elevated premiums to insure their portfolios against a potential market dislocation.
Adding to this, the SPX Put/Call ratio closed at 1.23 on March 26th. A reading above 1 means there are more puts than calls outstanding — more investors positioned to the downside, or hedging against it, than positioned to the upside. The VIX, meanwhile, has averaged 25.36 month-to-date in March versus 16.1 in February, and reached an intraday high of 35.30 mid-month.
What Is Put Delta and Why Does It Matter?
A put option gives its buyer the right to sell an asset at a predetermined price before a set expiration date. When large numbers of investors buy puts simultaneously, the market makers selling those contracts accumulate the opposite exposure — they go short delta. To hedge, they sell the underlying asset, which pushes the market lower. When those hedges are unwound as fear dissipates, the reverse process takes hold: forced buybacks that drive indices sharply higher. This is known as a short squeeze.
The Numbers Behind the Fear (Credit Markets)
The credit market is sending the same signal. Oracle's 5-year CDS have reached 191 basis points — levels not seen since 2008, and four times higher than mid-2025. This is not a signal of imminent default. It is something more revealing: the credit market is demanding a substantially higher risk premium than it did a year ago. Options and credit are pointing in the same direction.
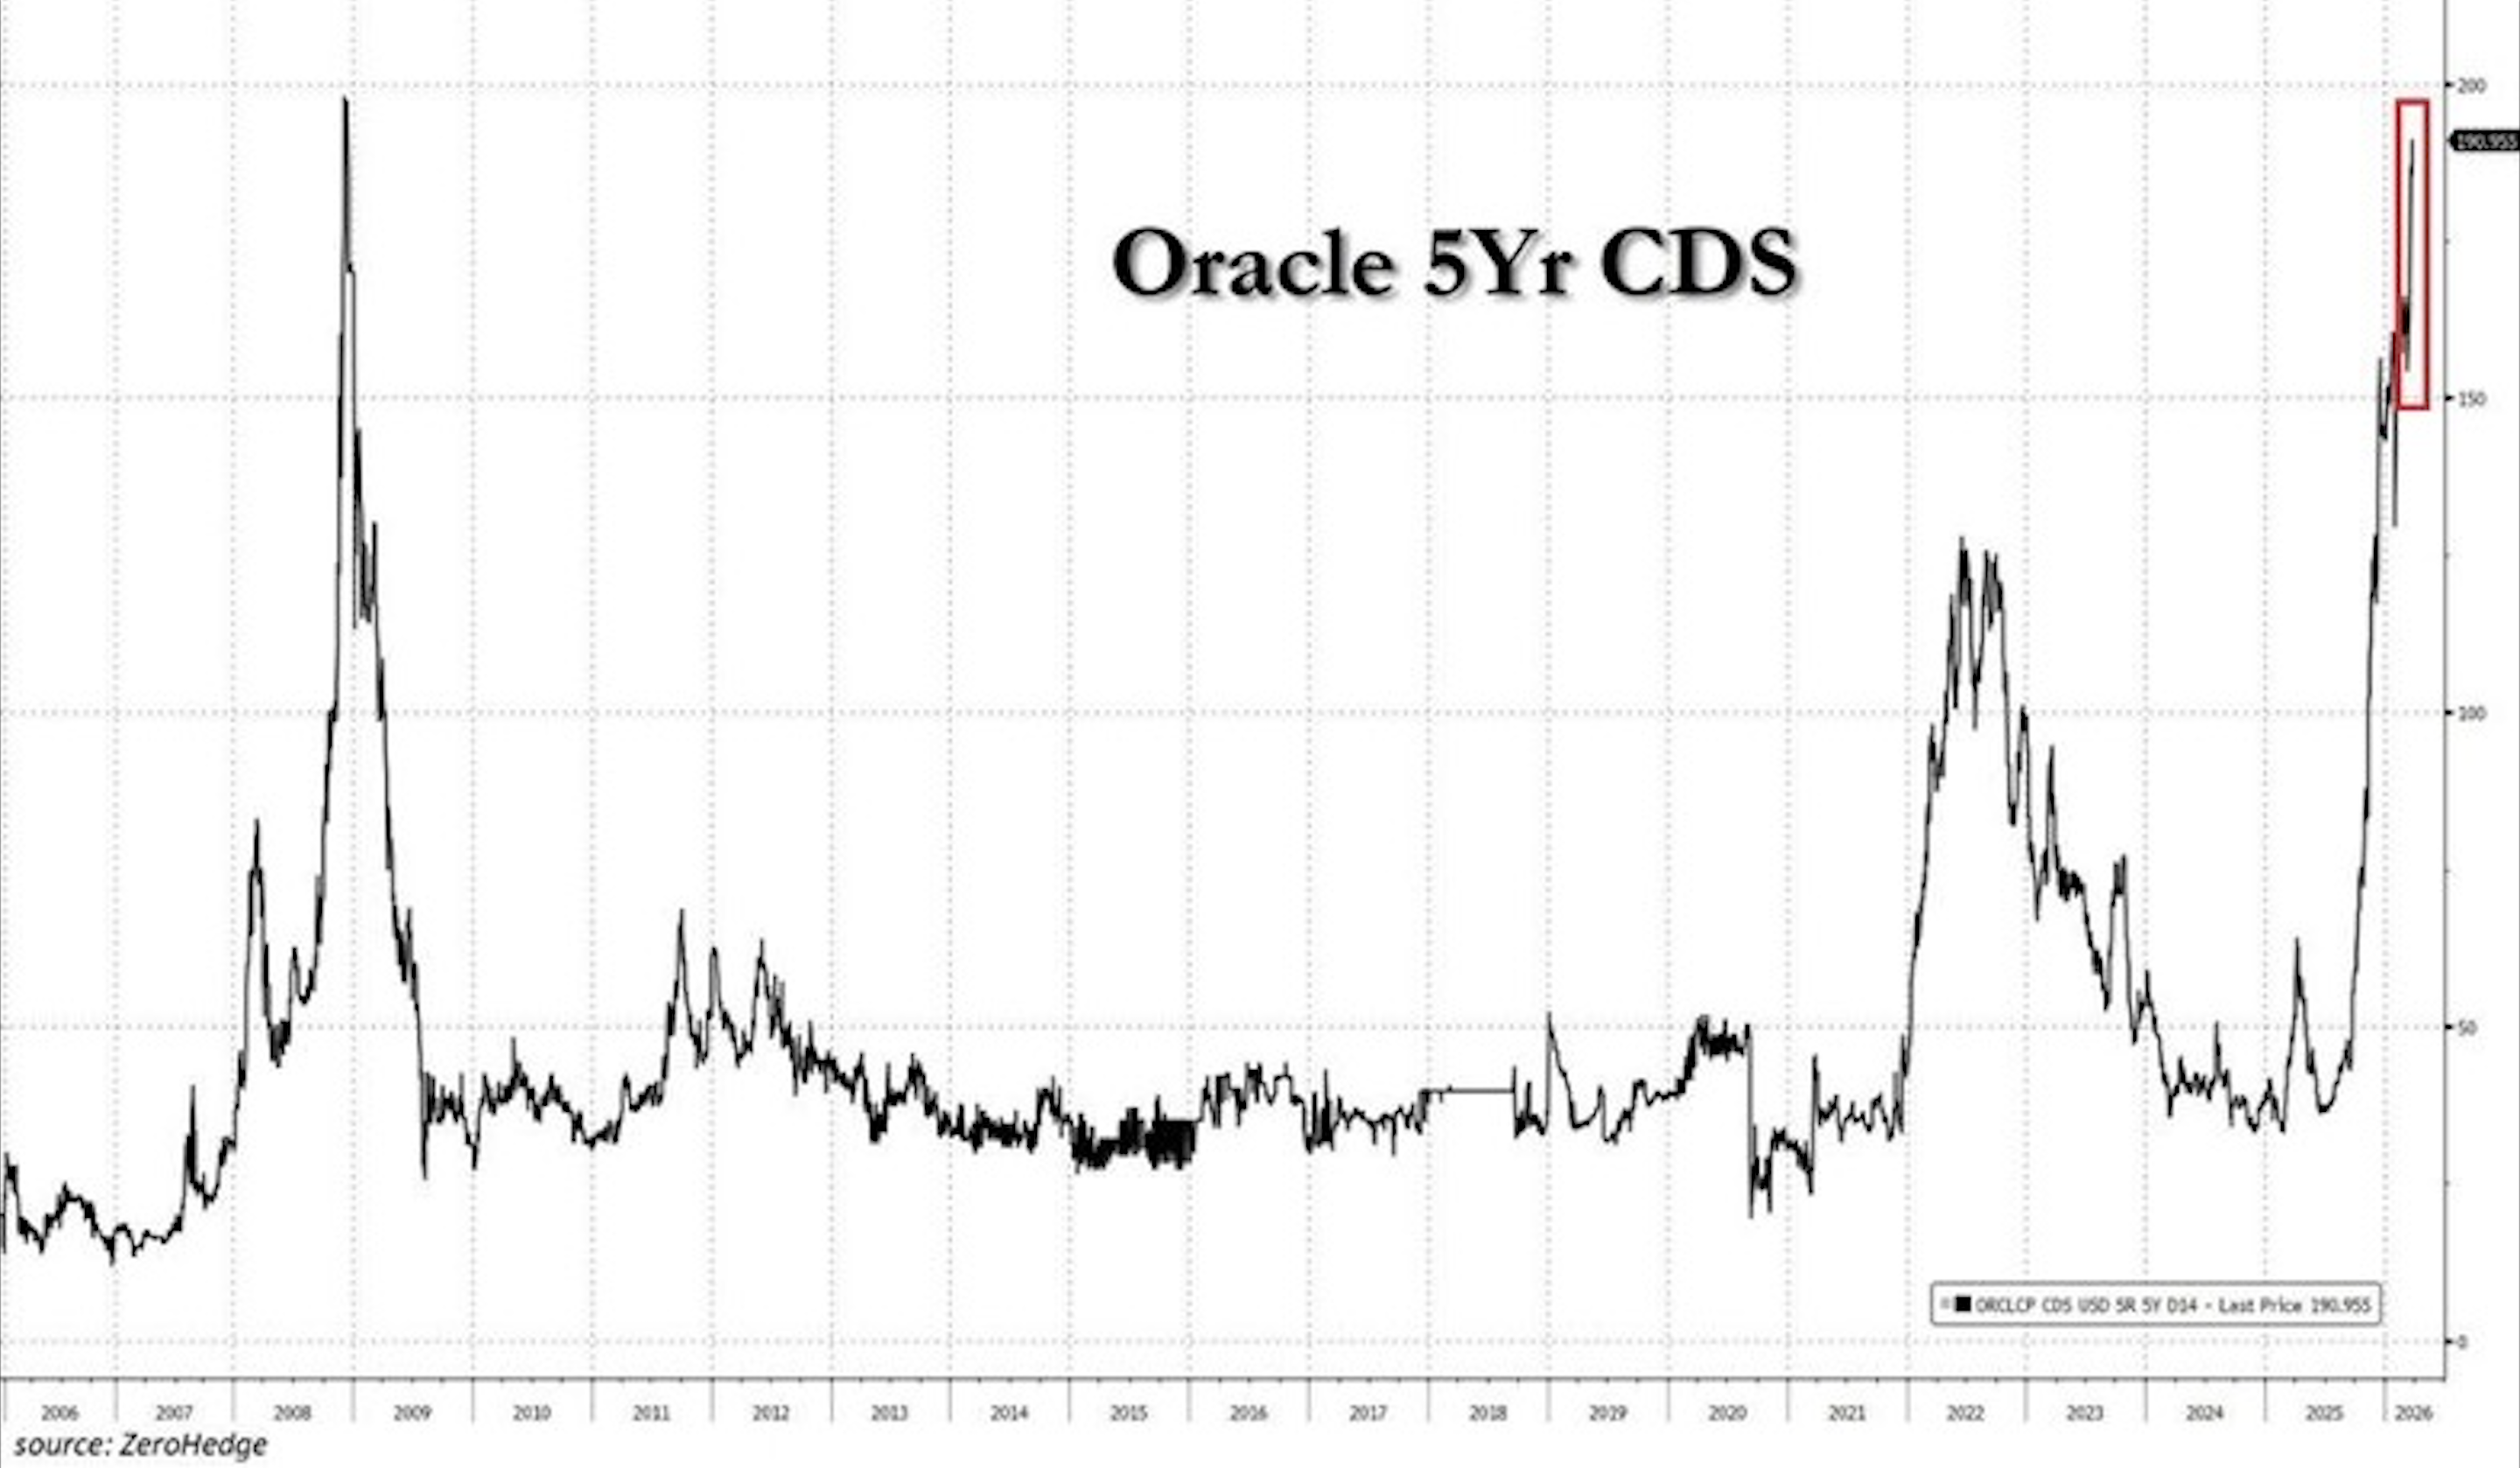
Source: ZeroHedge — Oracle 5Yr CDS (2006–2026). Last recorded price: 190.955 bps.
The Macro Context: When the Catalyst Is Real
What sets this episode apart from other moments of extreme defensive positioning is that, this time, the negative catalyst is real and verifiable. The US-Iran conflict, which escalated in late February, has effectively closed the Strait of Hormuz to commercial traffic — interrupting the equivalent of 17.8 million barrels per day of oil and refined product flows. The International Energy Agency has described the situation as the greatest global energy security challenge in history.
WTI closed Friday, March 27th at $99.64 per barrel, touching $100.04 intraday. Brent settled at $112.57. Goldman Sachs estimates a geopolitical premium of $14–18 per barrel embedded in current prices. The Dallas Federal Reserve projects that if the Strait closure lasts a full quarter, WTI will average $98 and global GDP growth will contract by 2.9% annualized.
This scenario has a direct historical precedent that markets are actively referencing.
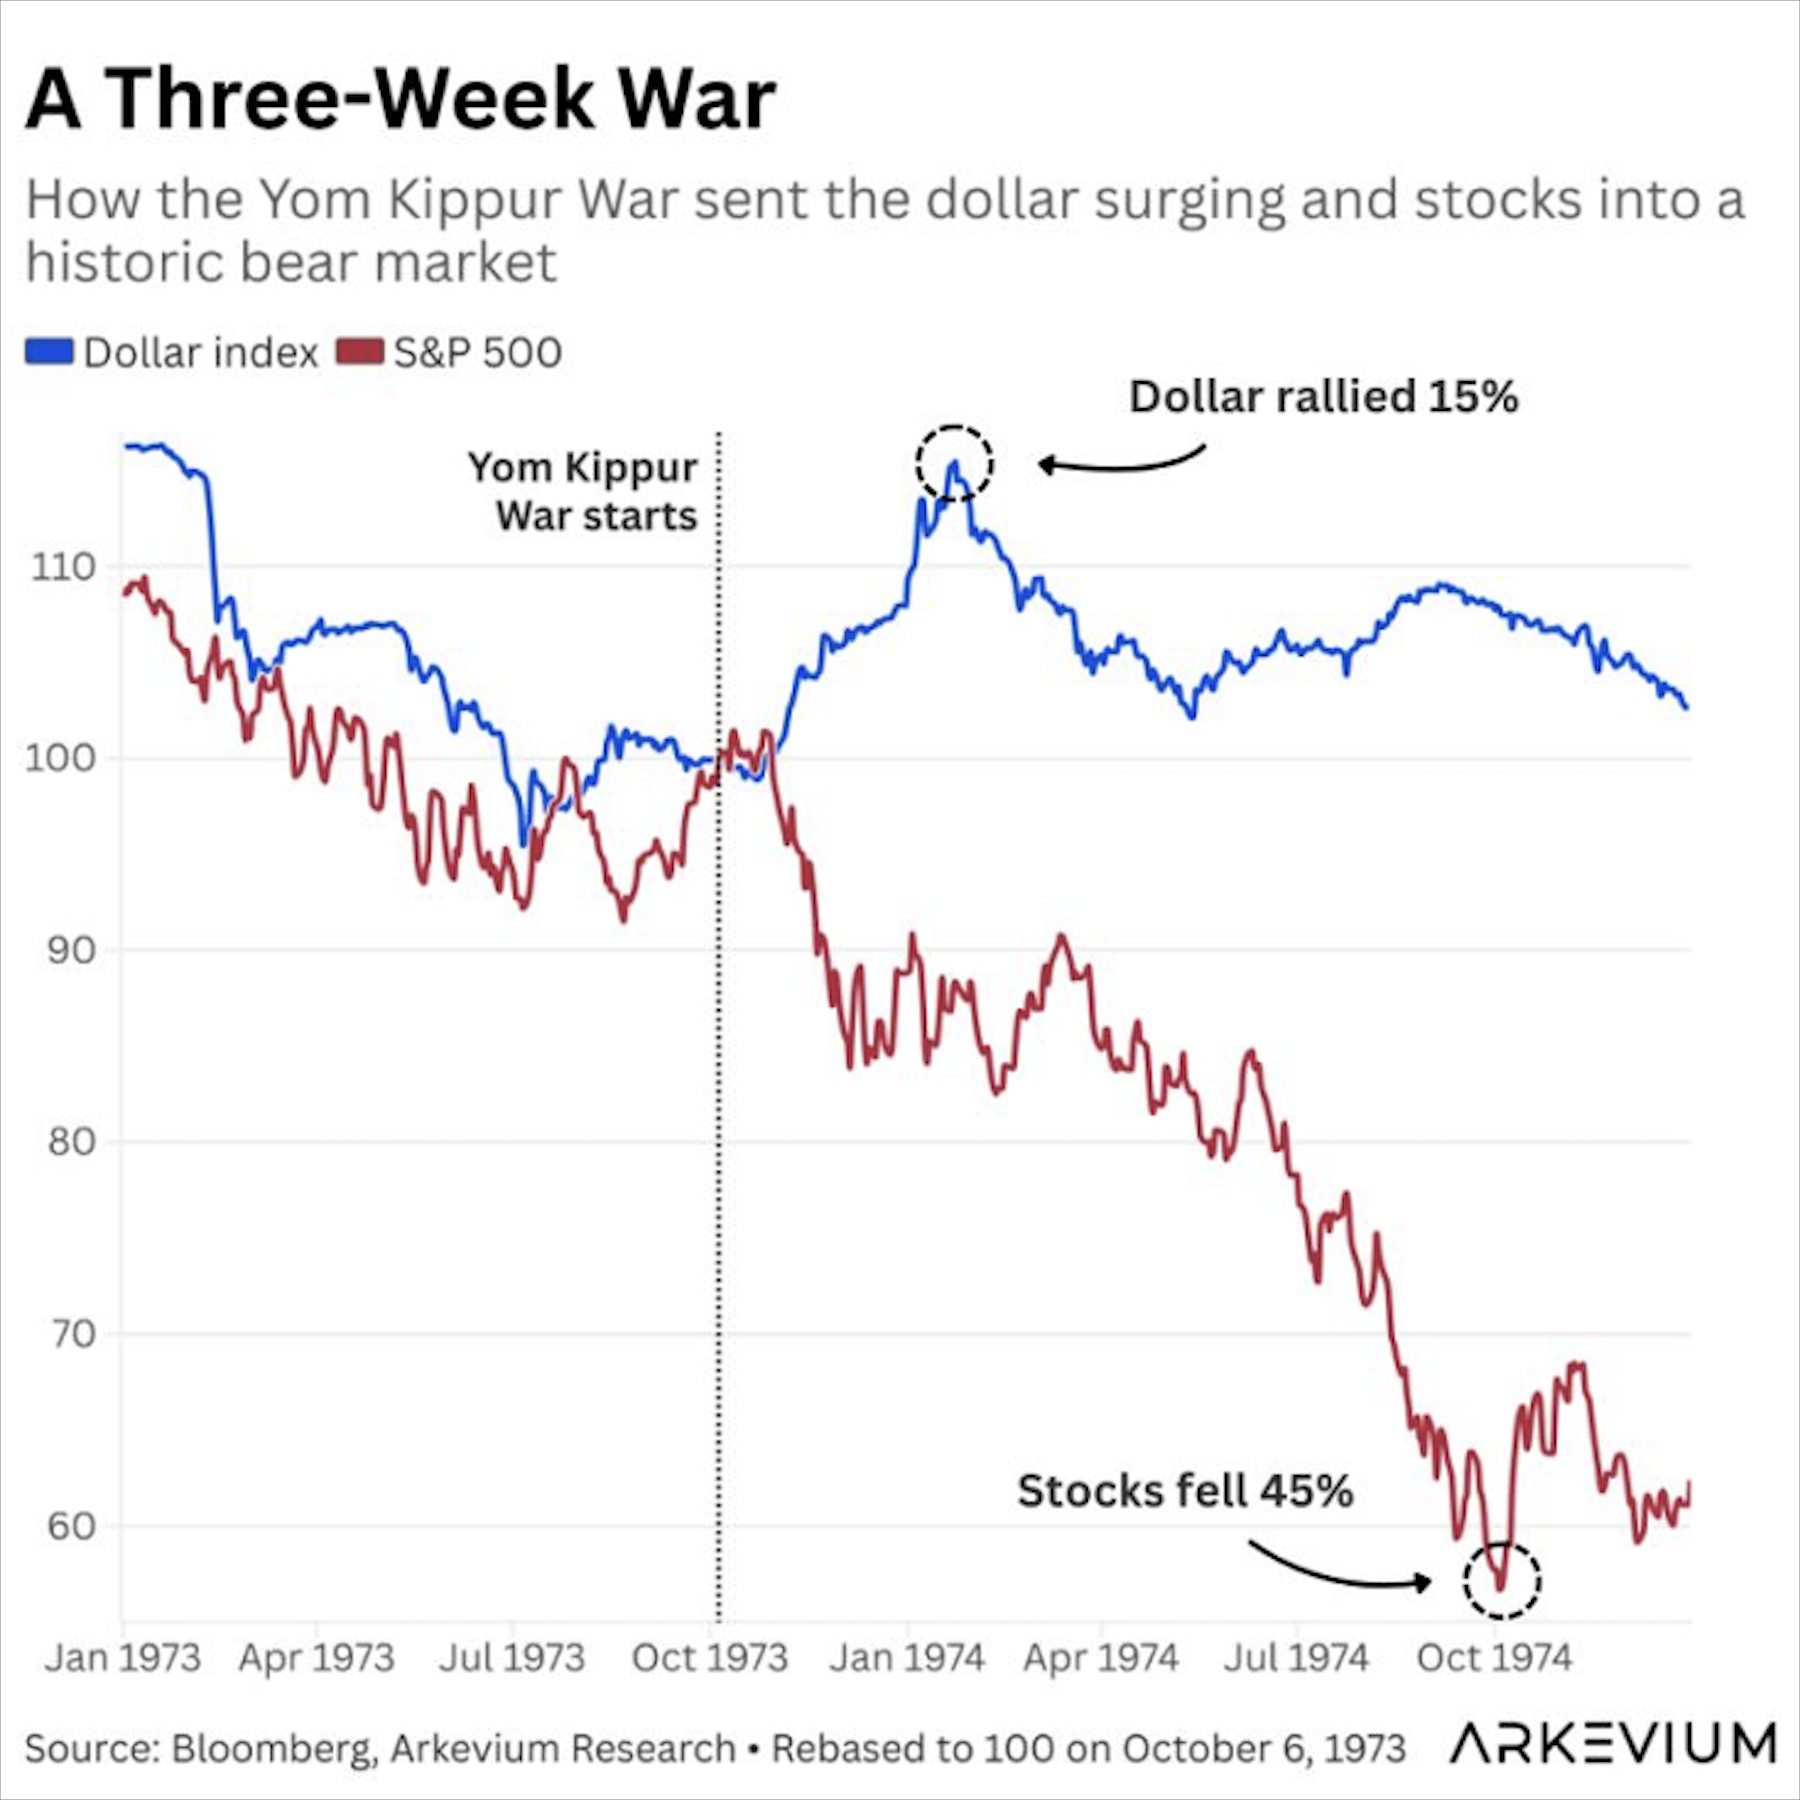
Source: Bloomberg, Arkevium Research — The Yom Kippur War (1973)
In October 1973, the Arab oil embargo triggered by the Yom Kippur War produced one of the worst equity selloffs of the 20th century: the S&P 500 lost 45% while the dollar appreciated 15%. But as always in markets, timing and the intensity of the shock were the determining factors. Those who bought at the peak of panic, when defensive hedges were at their most extreme, generated extraordinary returns over the following 12 months.
The key difference between 1973 and 2026 is that today's market has two mechanisms that market of that era lacked: massive strategic reserves, the IEA has agreed to release 400 million barrels, the largest release in history, and President Trump has extended Iran's deadline to April 6th to reopen the Strait. That date is now the next binary inflection point for markets.
The Dual Read: Contrarian Indicator or Justified Hedge
Positioning data has a critical property worth understanding clearly: it does not predict outcomes, but it does reveal where consensus is positioned. And when consensus is as heavily loaded with defensive hedges as it is today, any improvement in the macro environment, however marginal, can trigger a disproportionate upside move.
This is mechanics, not optimism. Market makers who sold those puts must hedge by selling the underlying as the market falls. When the negative catalyst fades or loses intensity, they must unwind by buying. That forced buyback process, layered on top of accumulated short covering, can generate fast and violent rallies, even with no structural change in fundamentals.
One additional data point reinforces this reading: the short-term VIX (VIX9D) has traded at a significant premium to the standard VIX in the final sessions of March. This indicates that panic is concentrated in the very near term, the coming days, not the coming months, which is consistent with a massive tactical hedge, not a structural long-term bearish repositioning.
Bull Case: if the Iran conflict de-escalates before April 6th, or simply does not worsen, the market has the fuel for a fast and intense rally. The combination of extreme options hedges accumulated short interest, and a VIX in capitulation territory creates the perfect setup for a gamma squeeze. In this scenario, the S&P 500 could recover to 6,600 in a matter of days, not weeks.
Bear Case: if the Strait of Hormuz remains closed beyond mid-April, the Dallas Fed is already modeling a global GDP contraction. In that case, current defensive hedges are not an anomaly, they are the beginning of a deeper adjustment. The VIX could revisit the 40–50 zone, and the S&P 500 correction would extend toward 6,000–6,200 or below.
The current positioning does not lie, the fear of a correction is real and measurable. But markets have a particular memory, March 2020, October 2022, August 2024, and that memory says that moments of extreme hedging have historically been the best entry points. Not because the risk did not exist, but because it was already in the price. Today the VIX is at 31, Put Delta is at historic lows, and the market has been paying record premiums for protection for weeks.
As Warren Buffett said: "Be greedy when others are fearful." Today, fear is historic, measurable, and collective. And the straits that block passage have historically not sunk those waiting in port, but those who had already abandoned ship.
Finance Generation · This article is for informational purposes only and does not constitute investment advice.